
The way people see your business often starts before they ever speak to you, buy from you, or visit your website for long. It starts with your branding. The trouble is, a lot of small businesses don’t realize when something feels off.
Maybe your message is unclear, your visuals don’t quite match, or your business just blends in too easily.
These kinds of branding mistakes are common, but they can be fixed. A few smart changes can make your brand feel more recognizable, more trustworthy, and much more like you.
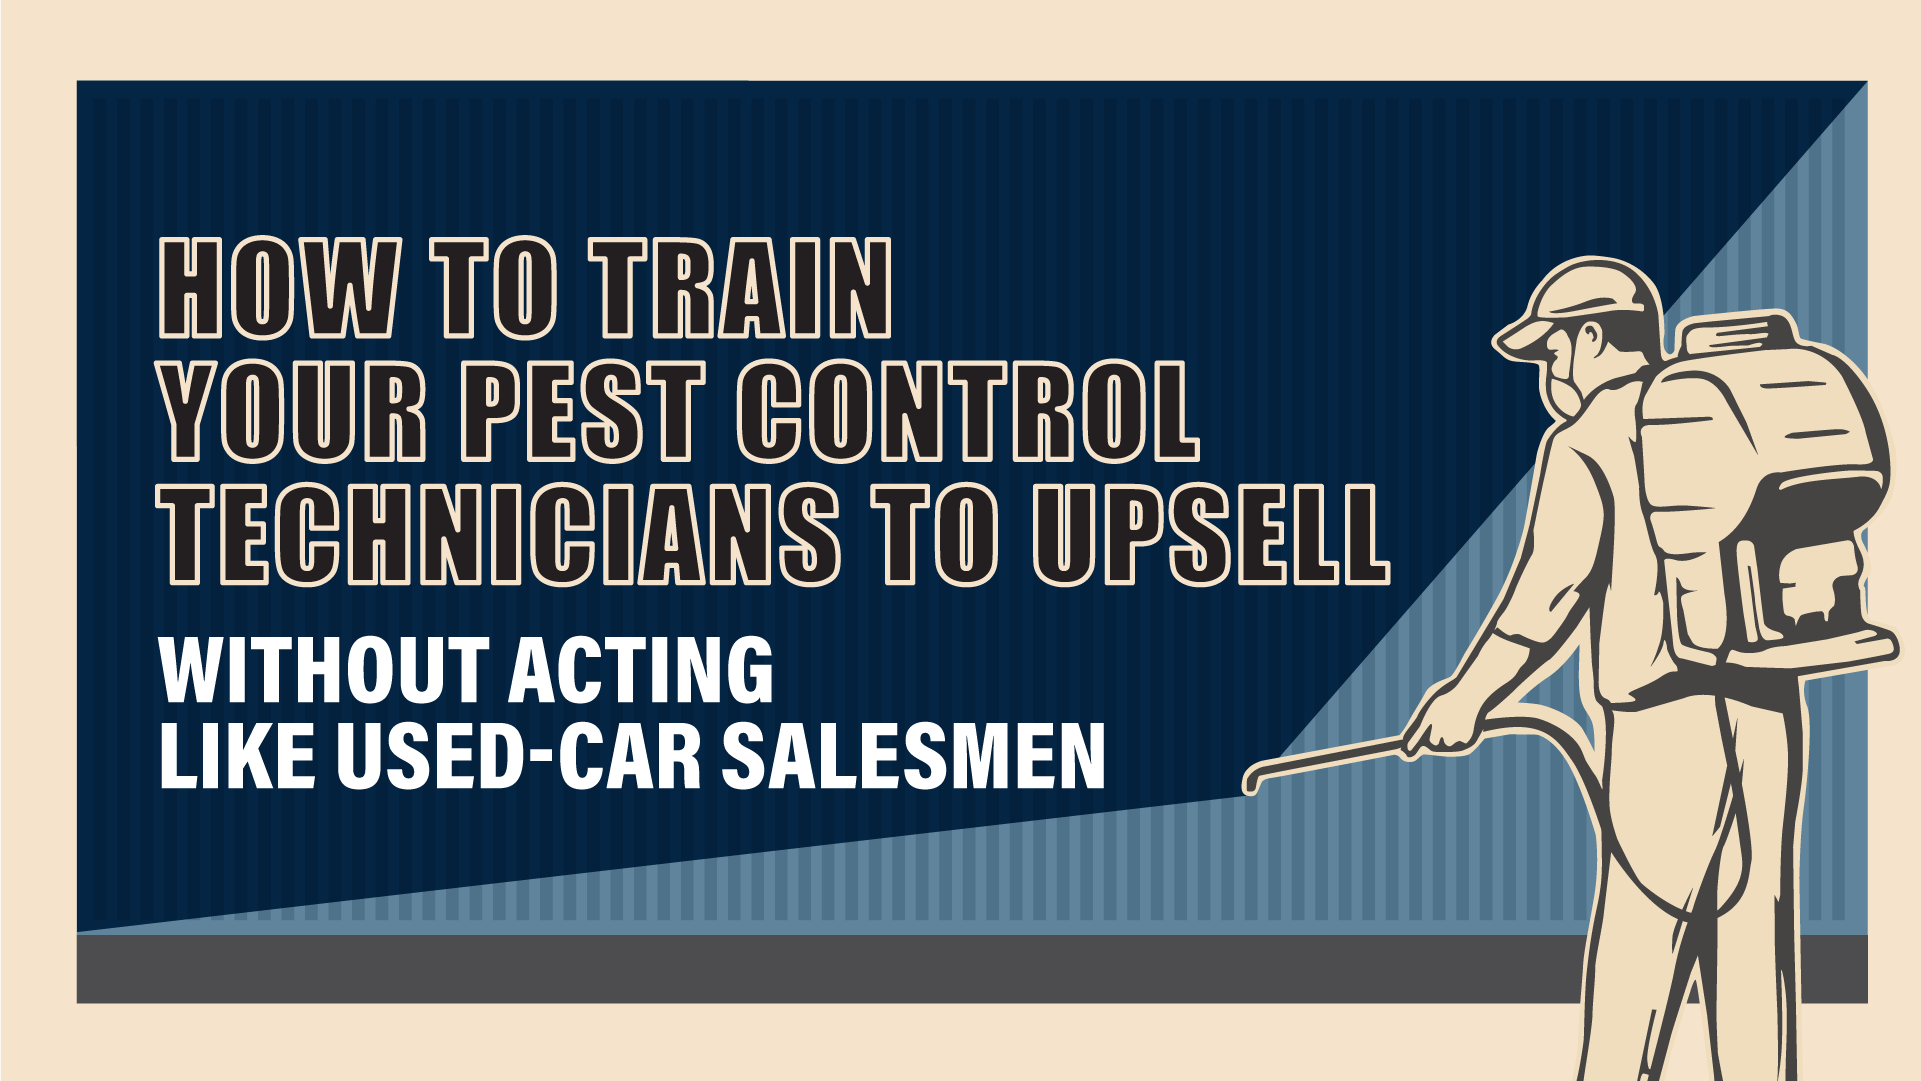
Pest control upselling, when the technician runs it well, is the cheapest revenue your business will ever earn, and the program your shop probably does not have. Your truck is already in the driveway. Your tech is already in the crawl space, looking at sagging insulation and a mulch bed pushed three inches up the siding. The customer is paid for. The only thing between that stop and another $400 to $4,000 of work is whether your tech opens his mouth, and whether he opens it in a way that does not make the homeowner feel cornered. For a 5-to-30 employee shop pulling $450,000 to $2.5 million a year, that one decision is the difference between a flat year and a 15% top-line lift.
I work with local pest control businesses at this size every week, and the pattern is the same. The owner knows upsells should be happening, the techs feel weird about asking, and nobody has built the program that connects the two. This is an owner problem, not a tech problem. Your job is to build a program that gives techs permission, language, training, and compensation that rewards the right behavior. This pest control upselling technician guide walks through how to do that without breaking your culture or your compliance posture.

Written By: Chad J. Treadway | May 19, 2026
Chad is a Partner and our Chief Smarketing Officer. He will help you survey your small business needs, educating you on your options before suggesting any solution. Chad is passionate about rural marketing in the United States and North Carolina. He also has several certifications through HubSpot to better assist you with your internet and inbound marketing.
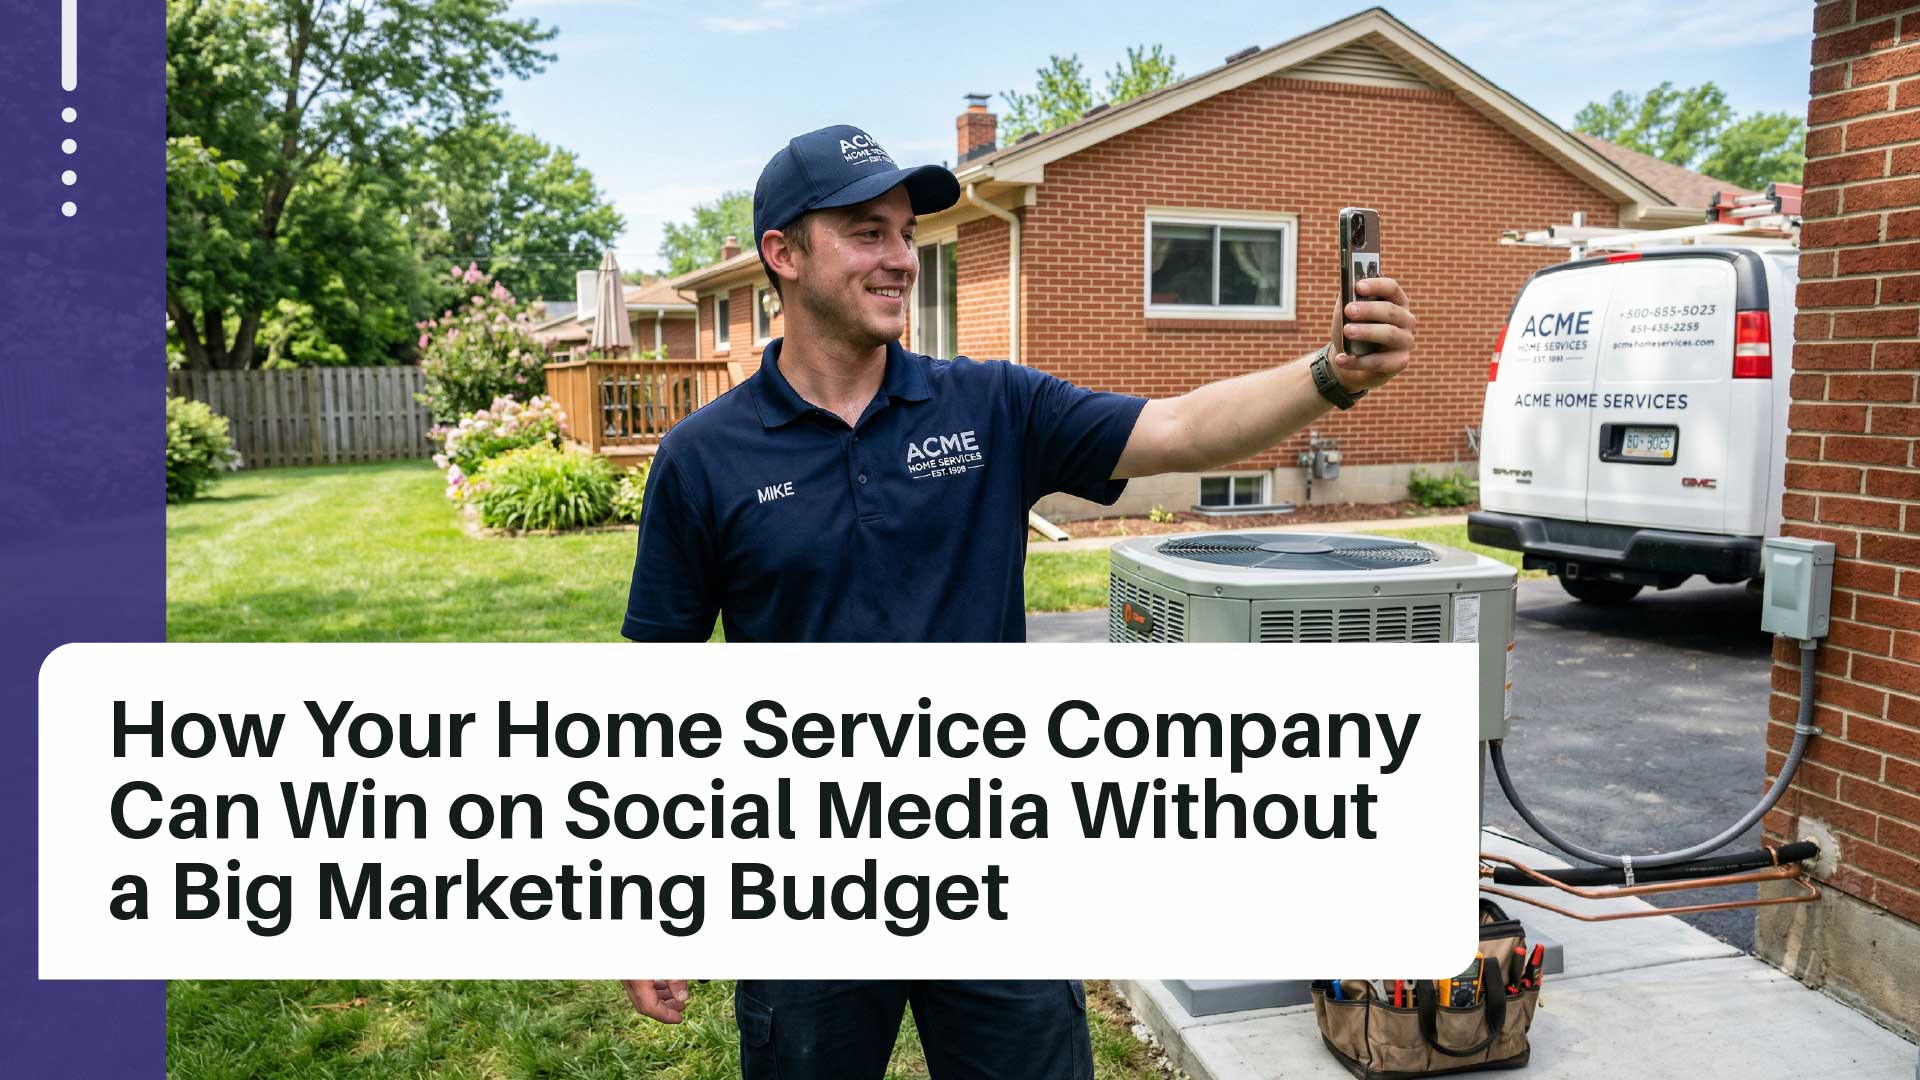
Your competitors are posting on social media. Some of them are posting well. And the ones doing it right are getting calls from homeowners who never even saw your truck drive by. Suppose that bothers you, good. It should. Because social media is not just for brands with marketing departments and content calendars pinned to the wall. It works for home service companies with five trucks and a shared office, too. You just need the right approach.
The problem is not that social media doesn't work for home service businesses. It does. The problem is that most service company owners treat it like an afterthought. A random post here, a shared meme there, then radio silence for three weeks. That is not a strategy. That is a waste of your time.
This post breaks down how to build a social media presence that actually produces results, even if your budget is closer to zero than it is to $1,000 a month.
Written By: Hannah Kilpatrick | May 19, 2026
Hannah Kilpatrick Cube Creative DesignHannah Kilpatrick graduated from Western Carolina University in 2021 with a Bachelor of Science in Communication with a Minor in Marketing and a Concentration in Public Relations. She has been around social media since its creation. (Meaning, she was in the first grade when Facebook became available to the general public.) As our very own professional Gen-Z, Hannah is a whiz when it comes to social media creation and paid advertising.
You can install a Ring doorbell with two-way audio, motion alerts, and an HD camera. But if you ignore the knock because you are out back fixing the lawnmower, the doorbell is not the problem. That is roughly what most pest control companies are doing right now. They are buying the digital version of the doorbell, AI chat widgets, 24/7 booking platforms, and after-hours answering services, while leaving the front door wide open during business hours, where the actual customers are knocking.
If you run a pest control company with 5 to 30 employees, the question on your desk is probably this: do I buy an AI receptionist, or do I just answer the phone faster? The data on the pest control customer experience has a clear answer. Before you spend a dollar on automation, the bigger payoff is in the basics. This is true for most independent pest control companies, and the math gets clearer as your operation scales.
The phrase "easy to reach" sounds like one feature. It is actually five things, ranked in order of how often customers mention them. Get the order wrong, and you will spend money on the bottom of the stack while the top of the stack quietly leaks leads to your competitors.
What Does "Easy to Reach" Mean to Pest Control Customers?
"Easy to reach" is a stack of five distinct expectations: fast replies during business hours, multiple ways to get in touch, clear contact information and operating hours, a way to make contact after hours, and 24/7 online scheduling. The order matters as much as the items themselves.
Scorpion's 2026 State of Pest Control Marketing Report breaks the stack down with a clean ranking. Customers cite fast business-hours replies (51%), multiple contact channels (46%), clear contact info and hours (34%), after-hours access (34%), and 24/7 online scheduling (22%). Read that list again. The thing 51% of your customers want costs you almost nothing to fix. The thing 22% want costs you a software subscription, calendar engineering, and a route-density rewrite.
Most pest control owners I talk to are doing it backwards. They are pricing AI chatbots before they have set a five-minute response window on web form submissions. The good news is the order is fixable, and the early wins are cheap.
Why Do Fast Business-Hours Replies Matter Most for Pest Control Customers?
Fast replies during business hours are the single biggest driver of the pest control customer experience. Over half of home-service customers cite response speed as their top reachability concern, and the conversion math punishes any company that lets a web inquiry sit. Most pest control companies still respond in hours, not minutes.
How fast is fast enough? In a study by InsideSales.com covering 5.7 million inbound leads, conversion rates were 8 times higher when reps responded within five minutes. Of those 5.7 million leads, fewer than 1 in 1,000 actually got a response that fast.
Every time you let a web lead age past your lunch break, you have already given the job to your competitor.
The home service category is no easier on slow responders. Jobber's Home Service Trends Report found that more than 70% of customers expect a response on the same day, and over half expect a reply within a single hour. Stretch that timeline and your pest control response time stops being competitive. Your competitor's speed becomes the standard.
The fix is mostly automation, not headcount. Set a five-minute response standard on every web form submission. Use your CRM (FieldRoutes, PestRoutes, ServiceTitan, or Jobber) to fire an instant text and email when the form lands. Make the message specific: "We received your request about pest activity. A dispatcher is reviewing the route now and will call from this number in the next 5 minutes." That message anchors the lead while your CSR finishes the call she is already on. It is the cheapest pest control customer service upgrade you will ever make.
Should Your Pest Control Company Offer Multiple Contact Channels?
Yes, but only if you can centralize them. Almost half of home-service customers expect more than one way to reach a business, including phone, text, web chat, email, and direct messaging. Multi-channel without a unified inbox produces lead leakage, not customer satisfaction.
Customers expect consistent service no matter which channel they use to reach you, and most say their experience across those channels still feels fragmented. Translation: the easy-to-reach pest control company is not the one with the most channels. It is the one whose channels actually talk to each other.
Pest control multi-channel contact looks great in a website footer and falls apart in practice. If your Facebook Messenger goes to one person, your SMS to another, and your web chat to a contractor in another time zone, you have built four ways to lose a lead. Running four channels without a unified inbox is a lot like wearing four cell phones on your belt: it looks impressive and drops half the calls.
The pragmatic answer for a 5-to-30 employee operation is a unified inbox that pulls Google Business Profile messages, SMS, Facebook, and web chat into one queue. Podium, Nextiva, and the native modules in ServiceTitan Contact Center Pro and Jobber's Client Hub all do this. As reported by ServiceTitan, 64% of contractors still rely heavily on phone calls, while thriving operators have already added two-way text and online forms to the mix.
A practical tip on web chat: instead of running a true live chat widget that demands instant staffing, set up an SMS-first chat widget. The customer types a question on your site; it lands on your CSR's phone as a text. The customer can leave the website without losing the thread, and your CSR can respond in five minutes from the dispatch desk.
How Important Is Clear Contact Info and After-Hours Coverage for Pest Control Companies?
Both elements tie at 34% of customers and share the same operational fix: digital hygiene and routing clarity. Clear info means accurate hours, phone, and service area on every directory. After-hours coverage means a real human or capable AI answers when your office is closed, not a generic voicemail.
Start with clear info because it is free. BrightLocal found that 97% of consumers read reviews for local businesses, and most check at least six different review sites before choosing one. If your hours, phone number, or service areas conflict between Google, Yelp, Angi, and your website, that conflict suppresses your local search visibility and erodes trust before a customer ever calls.
Reviews are part of the same picture. Data collected by BrightLocal indicates that 88% of consumers say they would use a business that responds to all of its reviews, and 87% expect that response within two weeks. A 4.6-star average with no owner replies looks like a company that does not pay attention. A 4.4-star average with thoughtful, timely responses looks like a company that does. The second one wins more bookings. That consistency is the foundation of solid pest control reputation management.
After-hours is where the real money leaks. A pest control call coming in at 7:42 PM on a Tuesday is almost always a homeowner who has just discovered a problem and wants help tonight. If they hit a generic voicemail, they hang up and call the next listing on the search results page. Phone leads are the highest-converting inbound channel in home services; Invoca's analysis of over 60 million calls found that home services phone leads convert at 46%, nearly double the rate of web form submissions. Depending on your average ticket and contract value, a single missed call costs somewhere between $285 and $1,200 in immediate revenue, plus the lifetime value of a customer who will now hire someone else.
You have two real options at this size: a live answering service trained on home-services intake, or an AI voice receptionist like Jobber's AI Receptionist or Avoca AI. Live services bring human empathy, which matters during a panicked bedbug call at 9 PM. AI options price flat per month, scale during seasonal swarms without surcharges, and write directly into your CRM. Many operations split the difference: AI handles overflow and routine after-hours intake, with a paged escalation path to the on-call tech for true emergencies. Google Local Services Ads also factor responsiveness into ad ranking, so an unanswered after-hours phone has a compounding cost in your ad spend.
When Does 24/7 Online Scheduling Make Sense for a Pest Control Business?
24/7 online scheduling makes sense when your business has tight ZIP-code-level routing, true CRM-to-calendar integration, and a list of services simple enough to book without a consultation. About 22% of customers want it, and that share skews toward younger, transaction-ready buyers who will not wait for a callback.
The size of the prize is real. Pest control companies with tight routing and standardized services can capture a real slice of their total bookings after hours, especially for recurring services like quarterly barrier sprays, mosquito treatments, and basic rodent inspections. Across all home services, Housecall Pro found that 41% of jobs booked online come in after hours, with a surprising concentration between 1 a.m. and 4 a.m.
The hidden risk is route density. Pest control profitability lives and dies on minimizing windshield time. A wide-open public calendar lets a customer book a Tuesday morning slot 30 minutes from your tech's actual route, which destroys margin on that ticket and the next two behind it.
The way to do this right is capacity-restricted booking. Show available slots only when a tech is already scheduled in that ZIP code that day. Restrict direct booking to predictable, flat-rate services. Anything that needs a structural inspection still routes through a phone call. If your field service management platform syncs natively with your dispatch board, you avoid most of the manual reconciliation that breaks online booking for everyone else.
What's the Right Order to Fix Your Pest Control Customer Experience?
Fix the cheap, high-impact items first and add the expensive ones last. A reasonable phased plan for a 5-to-30 employee pest control operation looks like 30 days, 90 days, and 180 days, each with a different focus. The order matters because each phase makes the next one easier.
In the first 30 days, fix the basics. Audit your Google Business Profile and clean up any inconsistent name, address, and phone data across Yelp, Angi, Facebook, and your website. Set a five-minute response window on every web form submission and turn on the automated text-and-email confirmation in your CRM. This phase costs almost nothing and usually closes the biggest leak.
Between days 30 and 90, focus on channels and after-hours coverage. Consolidate every inbound channel (Facebook, SMS, web chat, GBP messages) into a unified inbox. Pick one after-hours solution, either a live answering service or an AI voice receptionist, and set up your routing rules so every after-hours call lands somewhere a human or capable AI will respond. Map your emergency protocol so a true crisis pages the on-call tech and a standard inquiry queues for the morning callback.
From days 90 to 180, evaluate 24/7 online booking honestly. Map your service zones, identify your two or three most predictable services, and only then deploy a booking widget with capacity restrictions tied to your dispatch calendar. If you cannot enforce route density rules through the booking software, do not turn it on yet. Wait until you can. A booking platform that fights your dispatch board is more expensive than no booking platform at all.
Pest Control Customer Experience Is About Order, Not Volume
"Easy to reach" is not a marketing slogan. It is five distinct customer expectations stacked in a specific order, and the customers themselves have already told you what that order is. Fast replies first. Multiple channels second. Clear info and after-hours coverage third. 24/7 booking last.
Most pest control companies skip the top of the stack and start at the bottom. They buy a chatbot before they answer their web form on time. They open Facebook Messenger before they centralize their inbox. They hate their booking widget because it conflicts with their routes. The pattern is consistent. The fix is a different order, not a bigger budget.
If you are not sure where your own pest control customer experience is leaking leads, let's talk. I'll look at your current intake process, your channels, and your response times honestly, and tell you what to fix first. No tech subscriptions to upsell, just a clear sequence of work that makes your phone ring more.
Frequently Asked Questions
How fast should a pest control company respond to web leads?
A pest control company should respond to a web lead within five minutes during business hours. Research covering 5.7 million inbound leads shows conversion rates are 8 times higher when reps respond within that window. Connect your pest control website's intake form to CRM automation that fires an instant text and email confirmation while a CSR follows up by phone.
Is an AI chatbot worth it for a pest control company?
An AI chatbot or AI voice receptionist is worth it as a layer over solid business-hours response, not as a substitute for it. AI works well for after-hours intake, overflow during seasonal swarms, and routine scheduling questions. For an under-30-employee operation, fix your business-hours response time before paying for an AI front door.
What do customers actually mean when they say a pest control company is "easy to reach"?
Customers mean five things, in this order: fast replies during business hours, multiple contact channels, clear contact information and operating hours, an after-hours contact option, and 24/7 online scheduling. According to Scorpion's 2026 State of Pest Control Marketing Report, the first item alone is cited by 51% of customers, and it costs almost nothing to fix. The last item is cited by 22% and is the most expensive to deploy correctly.
Should a small pest control company offer 24/7 online booking?
A small pest control company should only offer 24/7 online booking if it has tight ZIP-code-level routing logic, native CRM-to-dispatch integration, and a short list of standardized, flat-rate services. Done correctly, after-hours booking can capture a meaningful share of total bookings. Done poorly, it destroys route density and erodes margin on the rest of the route.
What does multi-channel pest control customer service actually look like?
Multi-channel pest control customer service means a customer can reach you by phone, text, web chat, email, or social DM, and every message lands in the same unified inbox. Tools like Podium, Nextiva, ServiceTitan Contact Center Pro, and Jobber Client Hub centralize the channels into one queue. Without centralization, multi-channel becomes multi-leak.
Written By: Chad J. Treadway | May 18, 2026
Chad is a Partner and our Chief Smarketing Officer. He will help you survey your small business needs, educating you on your options before suggesting any solution. Chad is passionate about rural marketing in the United States and North Carolina. He also has several certifications through HubSpot to better assist you with your internet and inbound marketing.